
Read the data, explain the meaning
Use tables and charts to compare values and support a careful explanation.
The PDF includes 4 lesson images, practice pages and an answer key at the end. Print only the learner pages when needed.
You can also open the PDF to save or print it from your browser.
LOOK CLOSELY. TAKE ONE IDEA AT A TIME.
Read & notice.
Open each lesson image.
Use the text notes to check your understanding.
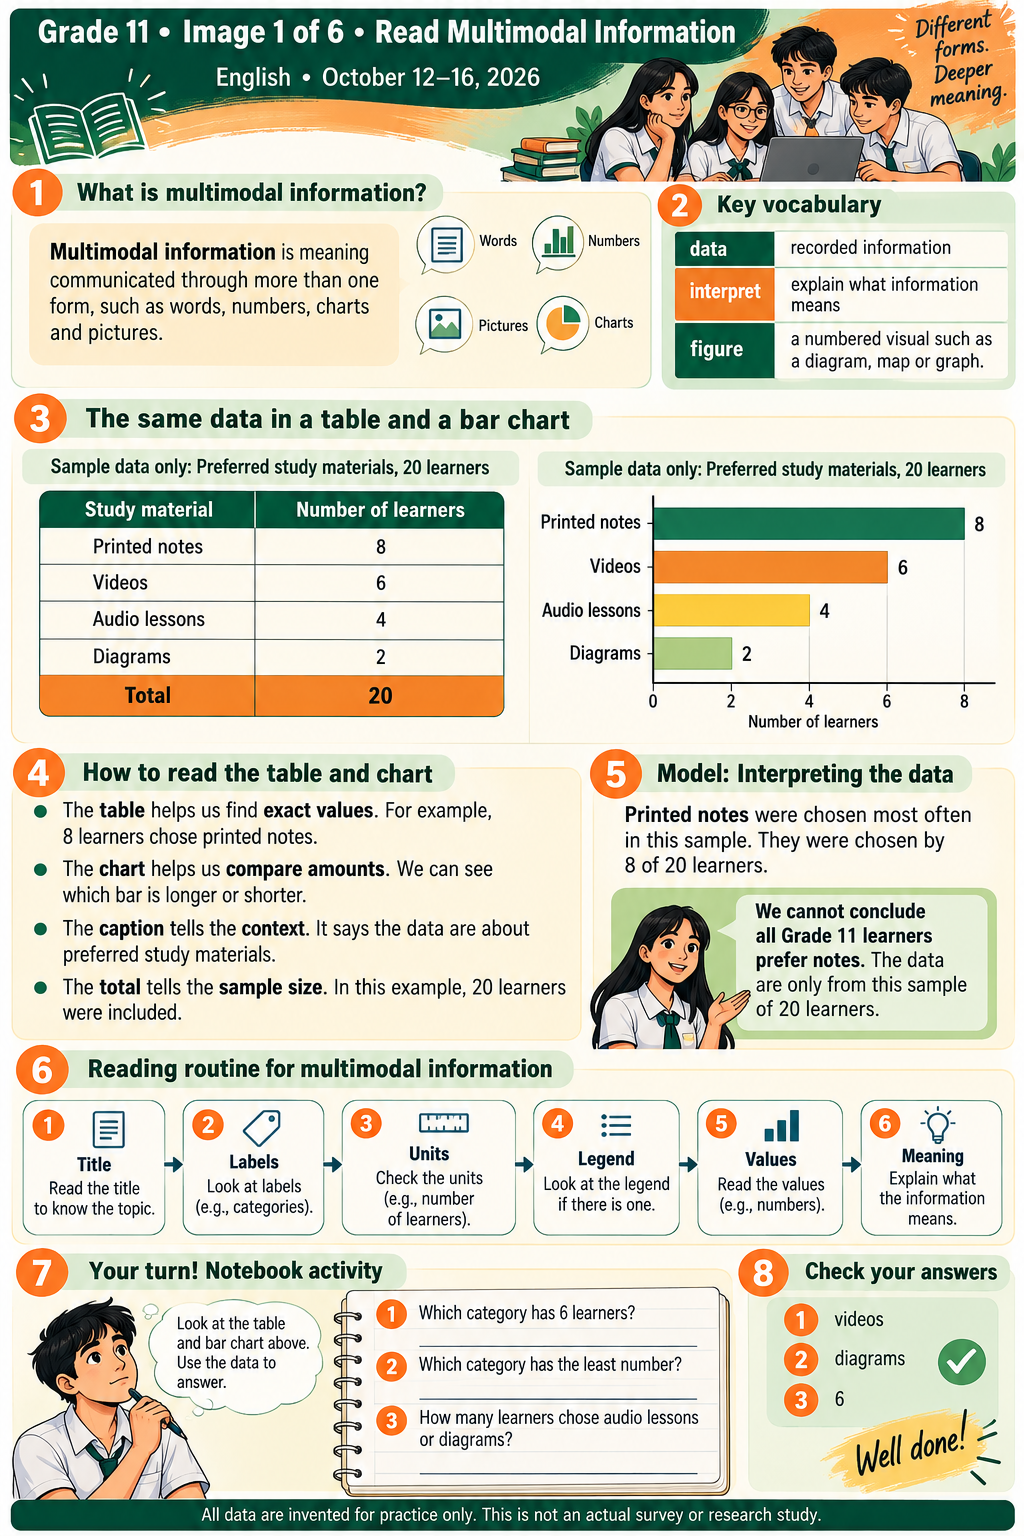
01Start with the title and labels
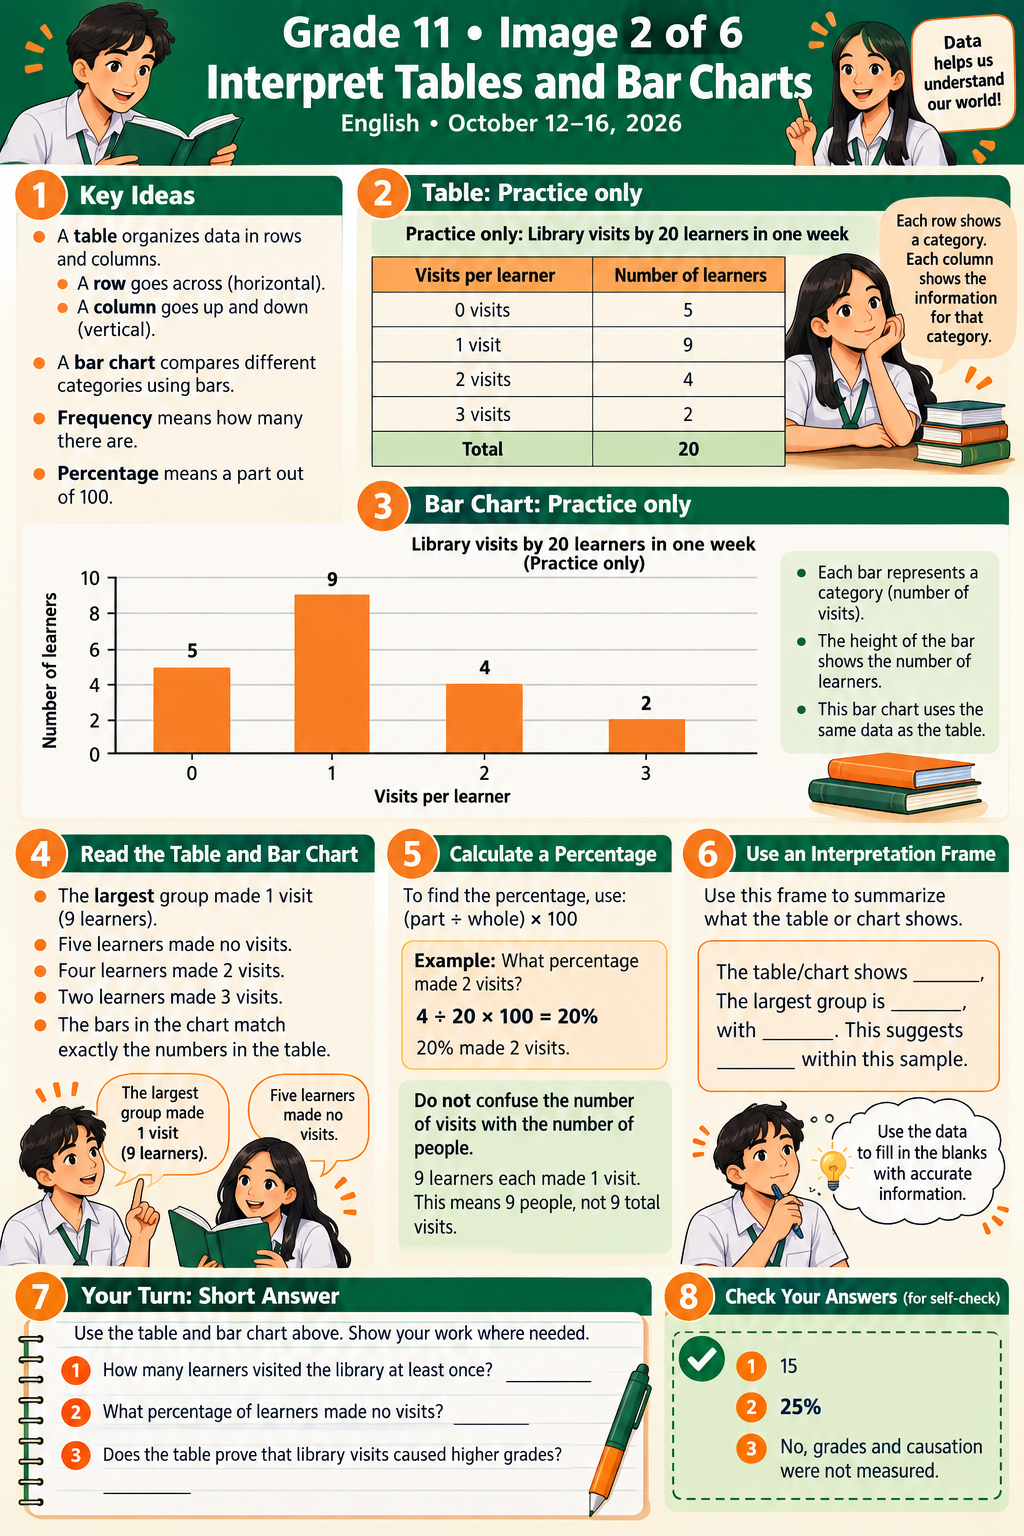
02Interpret a table and a bar chart
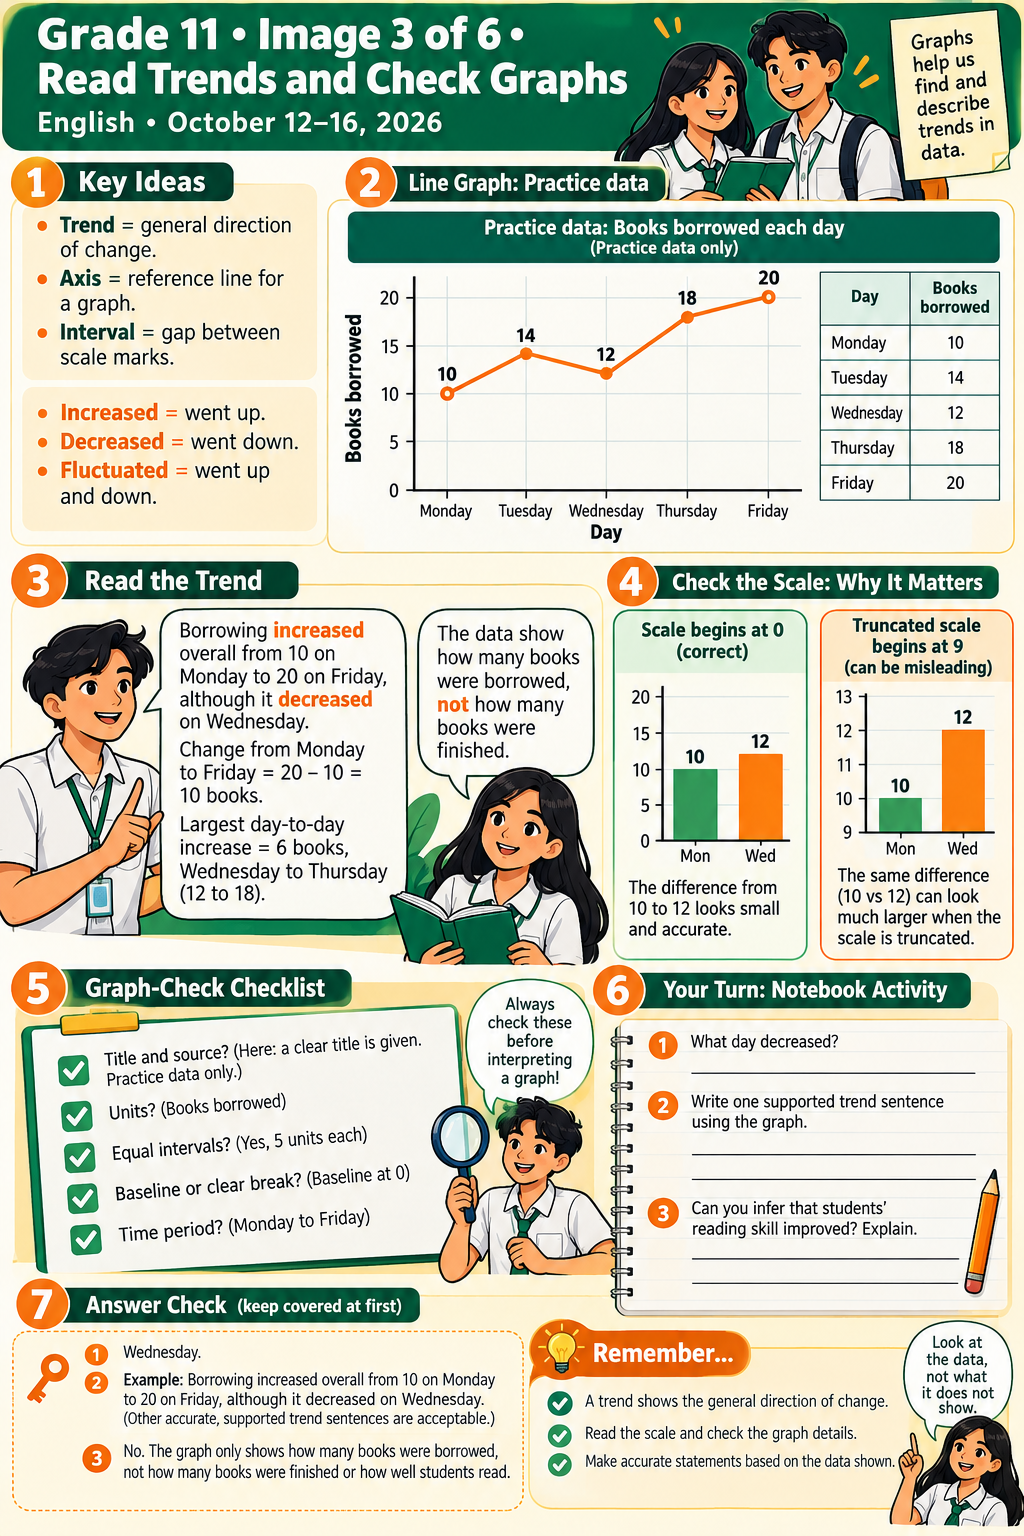
03Read trends and check graphs
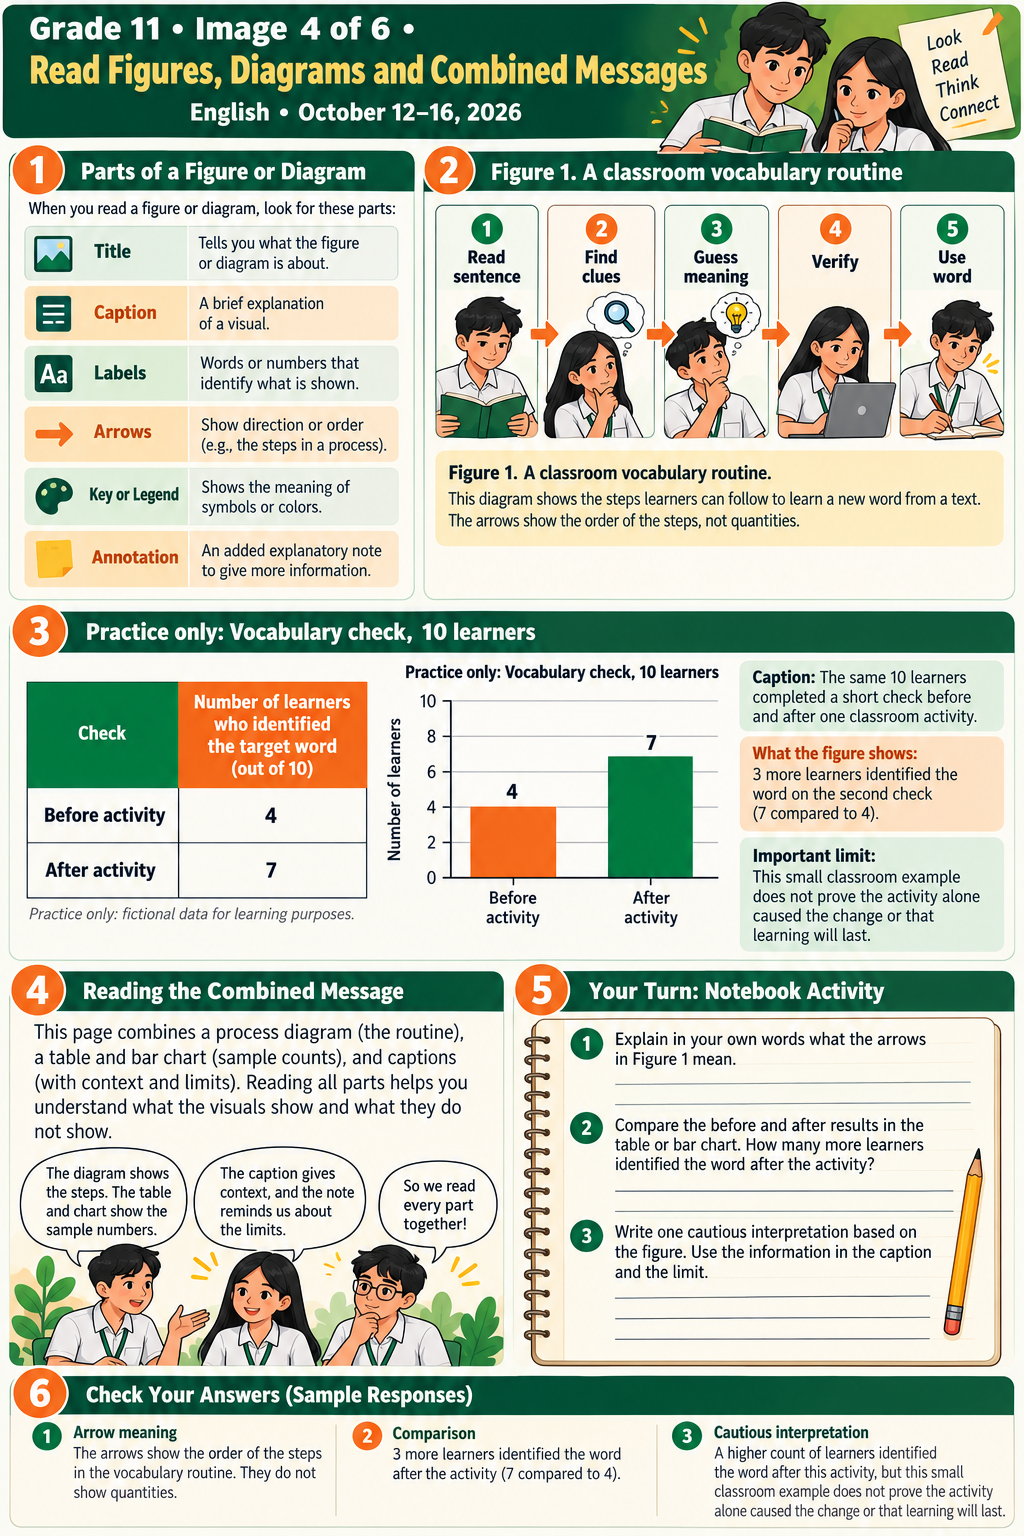
04Read figures and diagrams
YOUR LEARNING GOAL
Write an accurate interpretation of a small practice data set.
The ideas to keep
- Read the title, labels, units and source before making a claim.
- Tables organise data in rows and columns. Bar charts compare categories.
- In a process diagram, arrows can show order rather than quantities. Read the caption and labels together.
- Frequency tells how many people or items are in a group.
- Calculate a percentage with (part ÷ whole) × 100.
- Describe only what the data supports. A pattern alone does not prove a cause.
| Visits per learner | Number of learners |
|---|---|
| 0 visits | 5 |
| 1 visit | 9 |
| 2 visits | 4 |
| 3 visits | 2 |
| Total | 20 |
A MODEL TO LEARN FROM
In this practice sample, nine of the twenty learners made one library visit. That is the largest group. Four learners made two visits: (4 ÷ 20) × 100 = 20%. The table does not measure grades or prove that visits caused higher grades.
TRY. GET A CLUE. TRY AGAIN.
A little check-in.
Choose an answer for immediate feedback.
You can change your mind and try again.
YOUR IDEAS, WITH A LITTLE SUPPORT
Make it your own.
Complete the sentence frames.
Change the wording to make your ideas clear.
Your draft stays in this browser on this device. Download it before changing devices or accounts.
The table shows _____ in _____.
Need an example?
The table shows library visits by 20 learners in one week.
The largest group is _____, with _____ learners.
Need an example?
The largest group made one visit, with 9 learners.
_____ learners _____, while _____ learners _____.
Need an example?
Five learners made no visits, while four learners made two visits.
The data shows _____. It does not tell us _____.
Need an example?
The data shows how often this group visited the library. It does not tell us why they visited.
ONE LAST LOOK
Read it. Refine it. Keep it.
Say your response aloud, then check what you have done.
TAKE YOUR LEARNING WITH YOU
Download full lesson pack (PDF) ↓Offline worksheet & images (ZIP) ↓Save the PDF to read or print offline. The optional ZIP includes a browser worksheet and image files.
KEEP YOUR WORDS GROWING
Bring the practice into a story.
Explore Nico and the Last Chance in our teaching resources. Visit Stan for current products and prices.